PROJECTS

JAN 25 - PRESENT

Detecting Algorithmically Generated Domains (DGA) Using Machine Learning

Personal Project

Description

Detecting Algorithmically Generated Domains Using Machine Learning

1. Overview

This project aims to detect Algorithmically Generated Domains (DGAs), which are commonly used in malware command-and-control infrastructures. By building a machine learning pipeline that examines both linguistic and structural aspects of domain names, the system can identify suspicious patterns that distinguish malicious domains from legitimate ones.

2. Data Collection and Balancing

2.1 Data Source

The current dataset includes around 200,000 domains, evenly divided between legit and DGA samples. Legitimate domains were sourced from Alexa Top Sites, while DGA domains were curated from known malware families (e.g., Conficker, Kraken) and open-source DGA generators.

2.2 Balanced Dataset

As the data is equally split between legit and malicious domains, class imbalance was not a major concern, allowing for straightforward model training and evaluation.

3. Feature Engineering

Each domain is transformed into a set of nine features. These features were chosen to capture both the random-like properties of many DGA domains and the partial-linguistic patterns that some DGAs use to evade detection:

  • 1. String Entropy – Indicates randomness; DGAs often produce higher entropy than typical domains.
  • 2. Huffman Compression Ratio – Compares compressed size to raw size, revealing repetitive or random patterns.
  • 3. Length of Domain – DGAs sometimes generate unusually long or short domains.
  • 4. Longest Word in Dictionary – Some DGAs insert partial English words; legitimate domains often contain full words.
  • 5. Number of Substrings in Dictionary (≥ 3 letters) – Gauges how many recognizable chunks of real words appear.
  • 6. Vowel-Consonant Distribution (Binary) – Detects unnatural character transitions (e.g., random or forced alternation).
  • 7. Number of Uncommon Bigrams – Flags rare letter pairs that rarely appear in standard English.
  • 8. Number of Common Bigrams – Recognizes frequent pairs likely to show up in human-readable words.
  • 9. Frequency of Numbers – Identifies domains heavy in digits (often used by certain DGA families).

These features are MinMax scaled before model training to normalize the range of values.

4. Model Training

4.1 Random Forest Classifier & Validation

The project relies on a Random Forest Classifier trained under Stratified K-Fold Cross-Validation. This ensures robust performance estimation and avoids bias from a single train-test split. Additional tests on newly generated DGAs further assess the model’s generalizability.

4.2 Results and Ongoing Work

Preliminary results suggest strong classification accuracy on both known and synthetically generated malicious domains. However, real-world reliability depends on continued refinement and coverage of additional DGA families.

5. Next Steps

While the core detection model is functional, the project is not yet complete. Plans include building a lightweight application that can monitor real-time DNS requests and block malicious connections. Additionally, I aim to explore preemptive blocking by predicting domains that a DGA might generate in the future and denying them before malware can utilize them.

Technologies Utilized

  • Python (Pandas, NumPy, scikit-learn)
  • Random Forest Classifier
  • Stratified K-Fold Cross-Validation
  • Advanced Feature Engineering (Entropy, Huffman Ratio, Dictionary Substrings, etc.)
  • MinMax Scaling
  • Git

Documents & Code

AUG 24 - NOV 24

Predicting Football Match Outcomes using Machine Learning for a Positive Return on Investment

Personal Project

Description

Predicting Football Match Outcomes for Positive ROI

1. Overview

This project centers on building a machine learning model that predicts football match results (Home Win, Draw, Away Win) with both high accuracy and the potential for a positive Return on Investment (ROI). The approach incorporates a class imbalance solution, careful feature engineering, an ELO-based rating system for measuring team strengths, and a Betting Score mechanism to strategically select matches for wagering.

2. Data and Class Imbalance

2.1 Data Source and Distribution

  • Total Matches Analyzed: 170,958
  • Class Distribution:
    • Home Win: 44.55%
    • Away Win: 30.32%
    • Draw: 25.13%
The initial model trained on this naturally skewed dataset reached ~63% accuracy but disproportionately predicted Home Win, causing very low precision for the Draw class.

2.2 Undersampling Approach

After researching oversampling, undersampling, and SMOTE, the method that yielded the most balanced performance was undersampling the majority classes to match the minority class. This mitigated overfitting to Home Win. Below is a simplified Python snippet:

# Split dataset by label
            home_wins = df[df['label'] == 'Home Win']
            away_wins = df[df['label'] == 'Away Win']
            draws = df[df['label'] == 'Draw']
            
            try:
                # Use minimum sample count among classes
                min_samples = min(len(draws), len(home_wins), len(away_wins))
            
                # Downsample the majority classes
                home_wins_down = home_wins.sample(n=min_samples, random_state=42)
                away_wins_down = away_wins.sample(n=min_samples, random_state=42)
            
                # (Optional) Upsample draws if needed
                draws_balanced = draws.sample(n=min_samples, replace=True, random_state=42)
            
                # Combine into one balanced dataset
                df_balanced = pd.concat([home_wins_down, away_wins_down, draws_balanced])
                print("Successfully balanced dataset.")
            except Exception as e:
                print(f"Error balancing dataset: {e}")
            

This brought each class to near-equal representation, greatly improving minority-class (Draw) predictions and overall model balance.

3. Feature Engineering

3.1 Core Features

Feature selection was constrained to data available before each match to prevent data leakage. Key features included:

features = [
                'team_id', 'opponent_id',
                'odds_team_win', 'odds_draw', 'odds_opponent_win',
                'team_rest_days', 'opponent_rest_days',
                'team_h2h_win_percent', 'opponent_h2h_win_percent',
                'pre_match_home_ppg', 'pre_match_away_ppg',
                'team_home_advantage', 'opponent_home_advantage',
                # ELO-based features discussed later:
                # 'team_elo_before', 'opponent_elo_before'
            ]
            

Surprisingly, some expected strong indicators (e.g., pre_match_xg) did not significantly improve results. Meanwhile, odds and rest days proved moderately useful.

3.2 Recent Form Windows

The notion of “recent form” was explored using rolling windows of varying lengths (5, 10, 15, 20 games). Combining short-term (5-game) and long-term (20-game) intervals worked best, capturing both immediate performance spikes/slumps and overall consistency. Promoted or relegated teams had prior-league data discounted to avoid misleading comparisons.

4. ELO Rating System

4.1 Motivation

Team strength can vary dramatically, even across the same league year-to-year, due to promotions, relegations, or transfers. A conventional static statistic (e.g., total points) may not capture mid-season improvements or dips. An ELO-based rating system updates after every match, considering opponent strength to yield a more dynamic metric.

4.2 Implementation Details

def get_elo(RA, RB, home_advantage=0):
                """
                Calculate expected scores based on ELO ratings and home advantage.
                """
                RA_adj = RA + home_advantage
                EA = 1 / (1 + 10 ** ((RB - RA_adj) / 500))
                return EA, 1 - EA  # EB
            
            def new_elo(RA, RB, EA, EB, K, SA, SB):
                """
                Update ELO ratings based on match outcome.
                """
                RA_new = RA + K * (SA - EA)
                RB_new = RB + K * (SB - EB)
                return RA_new, RB_new
            

- Home Advantage was set to +100 ELO points.
- Promoted Teams reset to the average of the previous season’s bottom-three ELOs.
- Relegated Teams maintain their rating going into the lower league.

4.3 League Multipliers (Massey’s Method)

Inter-league matches (e.g., Champions League) revealed that matching ELO values in different leagues might not reflect comparable skill. A league-specific multiplier, derived via Massey’s Method, adjusts ELO based on relative strength across leagues. For instance:

england_premier_league   1.4128359412577263
            spain_la_liga            1.2362931173606426
            germany_bundesliga       1.0913212075321157
            ...
            netherlands_eerste_divisie   -1.9288377468922175
            

This ensures, for example, that a high-ELO team from a weaker league is calibrated if it faces a mid-level team from a much stronger league.

5. Model Training and Evaluation

5.1 Model Setup

from sklearn.ensemble import RandomForestClassifier
            from sklearn.model_selection import StratifiedKFold
            
            model = RandomForestClassifier(
                n_estimators=165,
                random_state=42,
                min_samples_leaf=1,
                n_jobs=-1
            )
            
            kf = StratifiedKFold(
                n_splits=10,
                shuffle=True,
                random_state=42
            )
            

A single RandomForestClassifier on a combined dataset simplified deployment. League-specific models were tested but offered only marginal benefits in certain leagues, and required more maintenance.

5.2 Results and Confusion Matrix

Final model performance after balancing and ELO integration:

  • Overall Accuracy: ~69.2%
  • Precision, Recall, F1: ~69.2% each
  • High Confidence Threshold (≥51%): ~91% accuracy on ~1/3 of matches (yielding fewer but more reliable bets)

Confusion Matrix (rows = actual, columns = predicted):

Home Win Away Win Draw
Home Win 44997 7329 12780
Away Win 5779 48544 10783
Draw 11156 12231 41719

Although slightly below the 70% goal, ~69.2% is respectable for multi-league football predictions. High-confidence subsets further strengthen accuracy above 90%.

6. Betting Score and ROI

6.1 Thresholding for Confidence

In practice, a betting strategy often ignores matches where no outcome exceeds a certain confidence (e.g., 51%). This subset boasted ~91% accuracy but covered fewer total matches.

6.2 League- and Team-Specific Patterns

Accuracy can vary drastically by team or league. Some teams, like Fulham or Brighton, proved harder to predict consistently, whereas others surpassed expectations when the model’s confidence was high.

6.3 Custom “Betting Score”

A specialized “Betting Score” was devised to blend multiple metrics:

  • Model Confidence Score (MCS)
  • League-Team Accuracy Score (LTAS)
  • Threshold-Team Accuracy Score (TTAS)

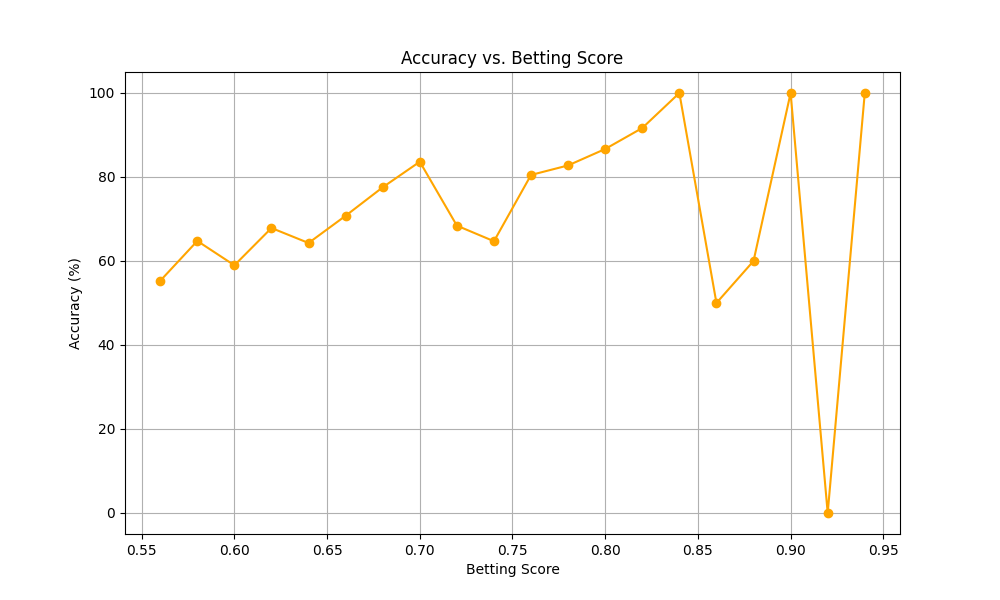
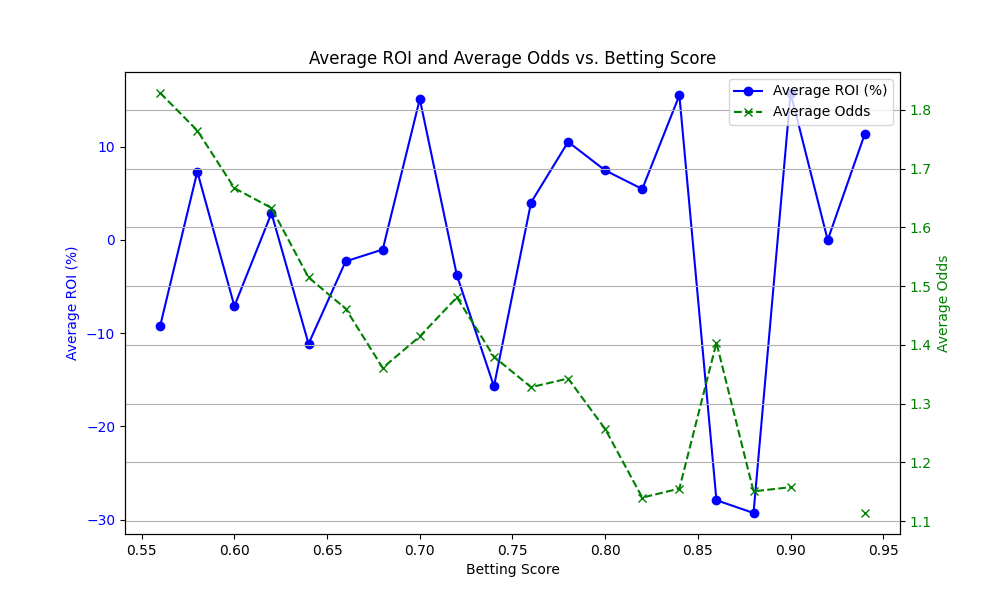
Weights (e.g., 0.7 MCS, 0.1 LTAS, 0.2 TTAS) were optimized via a Poisson-based method to maximize backtested accuracy and ROI. This helps isolate a “goldilocks zone” balancing high probability with favorable odds.

6.4 Visualizations

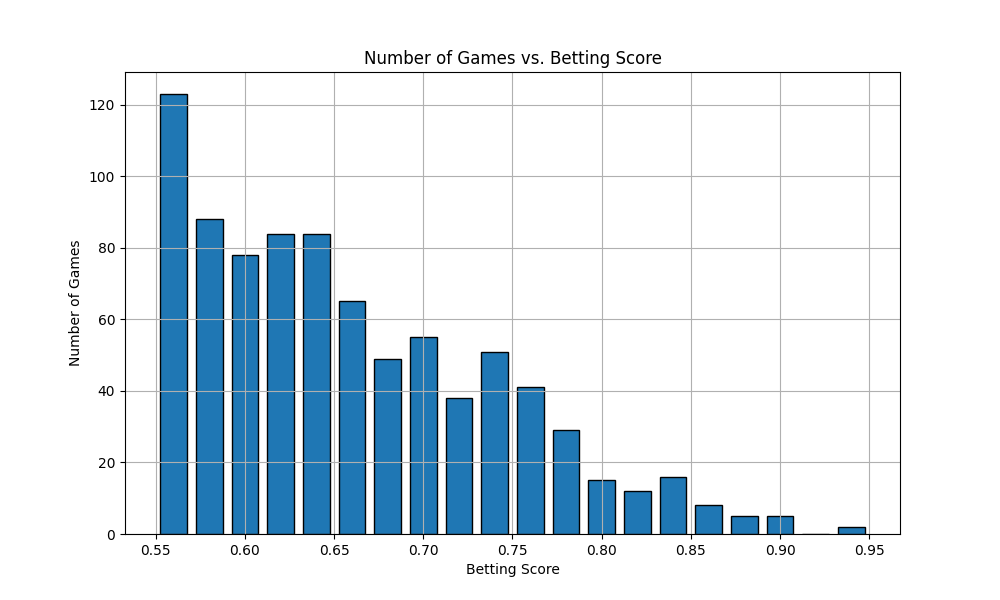
Below are charts illustrating how the Betting Score correlates with accuracy, ROI, average odds, and the total number of games in the dataset. These help verify that while higher scores typically translate to higher accuracy, they may also reduce the overall volume of matches or affect the average odds/ROI relationship.

Accuracy vs Betting Score
Betting Score vs Accuracy
ROI and Avg Odds vs Betting Score
Betting Score vs Avg Odds & ROI
Number of Games vs Betting Score
Betting Score vs Number of Games

7. Conclusions and Next Steps

7.1 Project Summary

Goal: Achieve a model that accurately predicts football match outcomes and can be leveraged for positive ROI in betting scenarios.

Key Points:

  • Class Imbalance solved via undersampling majorities.
  • Feature Engineering carefully curated time-sensitive data (odds, rest days, ELO ratings).
  • ELO Ratings captured team strength across leagues, addressing promotions/relegations and inter-league differences.
  • Performance reached ~69.2% accuracy overall, and ~91% for high-confidence cases.
  • Betting Score guides when to bet, balancing accuracy and odds for optimal ROI.

Utlisations

  • Python (Pandas, NumPy, scikit-learn)
  • Random Forest Classifier with Stratified K-Fold
  • ELO Rating System (Promotions/Relegations, League Multipliers)
  • Massey’s Method for Inter-League Calibration
  • Git

Documents & Code

NOV 23 - MAR 24

Engineering an Authentication Solution combining NFC and PKI

University Engineering Project

Description

This project aims to create a proof of concept novel authentication solution by combining NFC technology with Public Key Infrastructure. By conducting a review of similar solutions and the security of NFC technology, the project’s design specifications, as well as the functional and non-functional requirements can be collected. This project used the Scrum methodology as its software development life cycle, with the report providing information on its specific application. This report documents the implementation process where the design specifications and requirements are attempted. Following implementation, the product is then thoroughly evaluated against requirements, and the methodology is evaluated

Technologies Utilized

  • C
  • Python
  • Raspberry Pi
  • Linux Networking